The who, what, when, where, and why of congressional campaign spending
In what will come as a shock to no congressional observer, congressional campaigns are getting more and more expensive. The 2000 election cycle, for example, saw House candidates spend a combined $2.9 billion on their campaigns. In 2016, that number exploded to $4.05 billion. Last cycle, the average Representative raised $1.8 million for their reelection campaigns, up 80 percent from 2000.
And for those attempting to handicap specific congressional races, fundraising totals are often used as a key predictor of candidates’ success on Election Day. The equation is straightforward: candidates with bigger war-chests are better able to court voters via TV spots, voter data operations, consultants, and get out the vote efforts. Conventional wisdom says those who raise can spend, and those who can spend typically win.
Surprisingly, however, and despite its acknowledged link to candidate success, we know little about how campaigns actually spend their huge (and growing) amounts of raised monies, and how variance in these campaign spending decisions may ultimately impact electoral success. We know they buy TV air time, hire consultants, and print up yard signs, but we don’t have a good handle on how candidates choose to divvy up the fruits of their fundraising labor.
In an effort to learn more about how campaigns spend their raised campaign resources, we coded the 1.4 million individual transactions reported to the Federal Election Commission for all challenger and incumbent House general election campaigns from 2004-2016. And to better leverage the granularity of these itemized spending decisions, we coded each of the transactions on three specific characteristics: timing of spending, location of spending, and proportions of types of spending. By geo-tagging, time-tracking, and categorizing spending data at the transaction level, then aggregating to the candidate-level, we are able to speak to patterns and differences in campaign spending decisions that have previously gone unaddressed.
Competitiveness is the whole ballgame
Our main takeaway? How a candidate spends—amounts, location, timing, and on what—really depends on how competitive their race is.
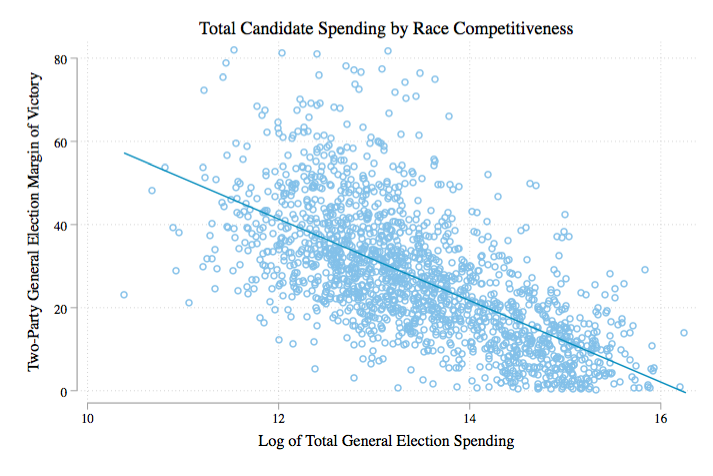
One thing we do know about spending is whichever campaign spends the most is by far the most likely to win. In fact, according to the Center for Responsive Politics, the higher spending House candidate wins over 90 percent of the time.
But, as the above figure makes clear, the relationship between levels of campaign spending and competitiveness is more nuanced than the stats may suggest—as the margin of victory decreases (that is, the more competitive the race is), the spending totals of campaigns increase. This makes some sense. When a race is more competitive, all candidates involved spend more than they otherwise would because the result isn’t a sure thing. Challengers locked in a more competitive race raise and spend more money given their increased likelihood of taking the seat, and in turn, ultimately get a higher percentage of the vote. Incumbents in a competitive campaign also raise and spend more in order to defend their vulnerable seat. Donors and parties recognize the best returns on their campaign fund investments lie in supporting the most promising challengers and in protecting the most vulnerable incumbents.
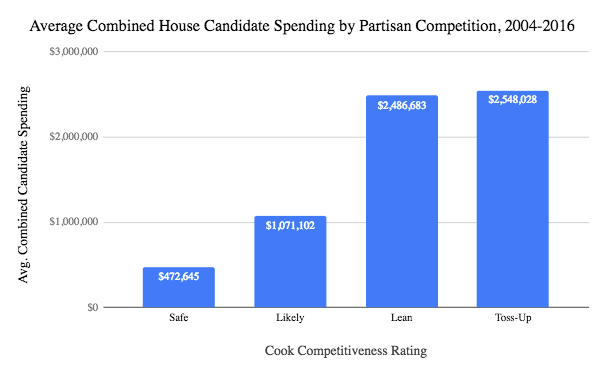
Broken down another way, the below figure shows the vast differences in spending levels for different classifications of competitiveness provided by the Cook Political Report. Candidates in safe seats spend about a combined $500,000, on average. Candidates in the most competitive ‘toss-up’ category spend over $2.5 million, a fivefold increase in spending totals compared to those in safe districts. This finding suggests that the “highest spender wins 90 percent of the time” statistic applies to fewer and fewer competitive House districts.
Going beyond total spending
So what does spending look like in competitive campaigns, and how is it different? After analyzing newly-parsed data from the FEC, we found that competitiveness affected much more than just total amounts spent. Challengers and incumbents also vary significantly on when, where, and on what, they spend their raised funds. The closeness of the election causes most of this variation.
First, after coding the purpose of every individual campaign transaction for each House race, we found some pretty glaring differences between safe and competitive races in campaign spending decisions. All campaigns, safe and competitive, challenger and incumbent, spend a plurality of their raised funds on advertising. But in uncompetitive—‘safe’ or ‘likely’ to be won by one party—races, there is a more even distribution of spending in other areas like administrative expenses, consultants, staff, and travel. We also see that uncompetitive challengers appear to overspend on some things (campaign materials like lawn signs, bumper stickers, and other paraphernalia) and underspend on others (fundraising) when compared to incumbents in those safe districts.
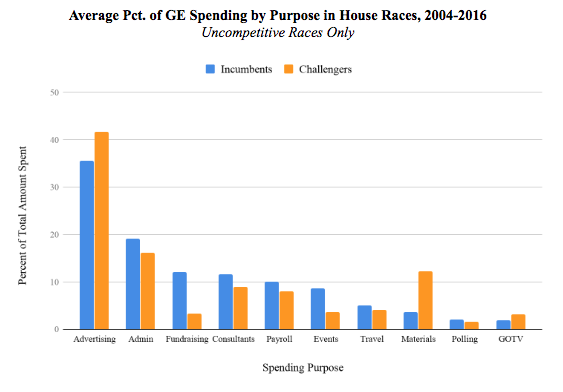
For close races it’s a much different story. While advertising is no doubt the biggest expenditure even in safe races, it completely dominates for both challengers and incumbents in competitive ones, comprising over 3/4ths of the average candidate’s general election spending. All other types of spending pale in comparison. One possible explanation for this dearth in spending on things like get-out-the-vote (GOTV) efforts is that outside groups and parties are covering these services for competitive races. Alternatively, campaigns may perceive advertising as the most marginally-effective way to spend funds in competitive races; that is, competitive campaigns may spend similar total amounts on other services and items as uncompetitive ones, but just spend far more on advertising. However, another notable trend in this data is that challengers and incumbents track very closely with each other’s spending habits in competitive races rather than diverging on key areas.
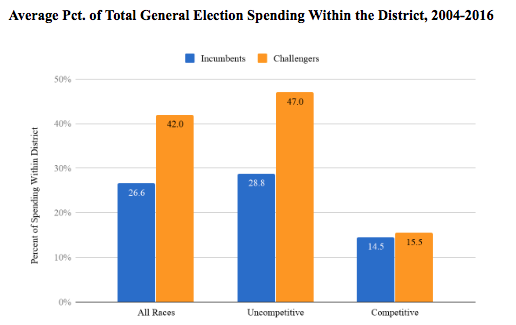
A second dimension of spending we looked at was geography—specifically, whether candidates spent inside the boundaries of the district or not. The rate of in-district spending can indicate a number of things, including the extent of a candidate’s political and economic networks in and out of the district. This also could be an indicator of the types of things they’re spending on — namely, services like advertising, which is often produced by out-of-district firms.
Here again we see huge divergence between challengers and incumbents, with challengers spending nearly half their funds inside the district in uncompetitive races. But once again, when limiting to competitive races only, challengers and incumbents spend almost identically.
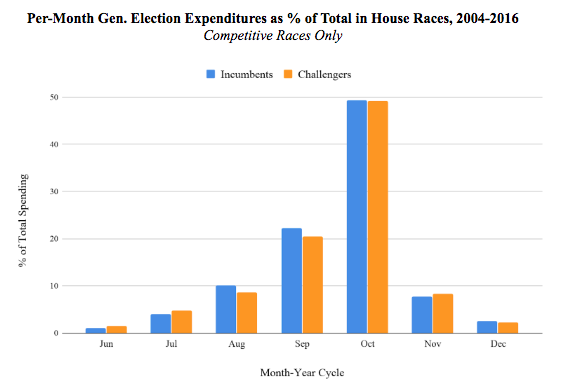
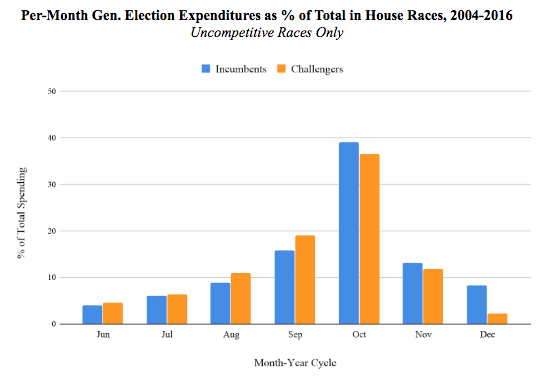
Finally, we looked at timing of spending—when are candidates spending the most? When do they see their money as having the greatest impact in the general election? While October may come with other surprises, candidate spending is not one of them. And according to our analysis, spending in the last few weeks of the election should be even less surprising in competitive races, where October spending accounts for very nearly half of all general election spending for the average incumbent and challenger alike. And once again, particularly in the crucial months of October and November, challenger and incumbent spending timing track closely with each other in more competitive races.
Why is this happening?
What accounts for these differences? More specifically, why do challengers match their incumbents’ spending habits with such precision in close races? One likely explanation is that when races are competitive, both candidates—not just incumbents—have access to seasoned professional staffers and consultants who have more experience running campaigns. These operatives, who often come from the national, state, or local party apparatus, have ideas based on previous experience about what works in a competitive campaign. Whether or not the conventional wisdom about “what works” is actually correct, it appears that challengers at least have access to this type of professionalism. And this is probably to the challenger’s benefit, who in competitive races can adopt the “winning formula” that incumbents have used to great effect for years. This effect makes competitive races exciting, but perhaps more predictable in how they’re run.
Another possible explanation is that in close campaigns, challengers and incumbents are engaged in a continuing game of spending cat and mouse, constantly acting and reacting to each other and their spending decisions. On the other hand, challengers taking on safe incumbents are more likely to be less professionally staffed, less well-endowed with funds, and less able to react effectively. As a result, incumbents need not track their challengers’ activities closely, and thus feel freedom to spend as they please rather than from a more competitive playbook.
Whatever the reason, these observations should hopefully shed some light on some of the dirty details of how campaigns operate, how they react to each other, and possibly why we see so many damn advertisements every couple of Octobers.
| Topics: | Parties, Campaigns, & Elections |
| Tags: | Casey Burgat Charles Hunt |